SELECT CATEGORY
Discover free nonprofit investing resources, including policies, guides, and templates, to keep your investment or endowment program running strong.

Passive Investing for Nonprofits

Discover free nonprofit investing resources, including policies, guides, and templates, to keep your investment or endowment program running strong.
For most nonprofits, a low-cost, index-based portfolio built on a thoughtful asset allocation can be a sound, durable way to help fund the mission over decades.
Part 1: What Passive Investing Is, and Why It Works Passive investing means gaining exposure to a whole market at very low cost instead of trying to pick the parts of it that will do best.
Part 2: “Active Passive” in Practice A passive portfolio still requires many active decisions. What changes is where the effort goes.
Part 3: Why Passive Fits Nonprofits, and How Boards Oversee It For nonprofits, passive investing can be especially compelling because of how they are governed, the laws that apply to them, and the way their spending works.
For most nonprofits, a low-cost, index-based portfolio built on a thoughtful asset allocation can be a sound, durable way to help fund the mission over decades. It is also a relatively easy approach for a volunteer board to explain, oversee and hand down to the next committee.

This paper makes that case in three parts, each of which can be read on its own.
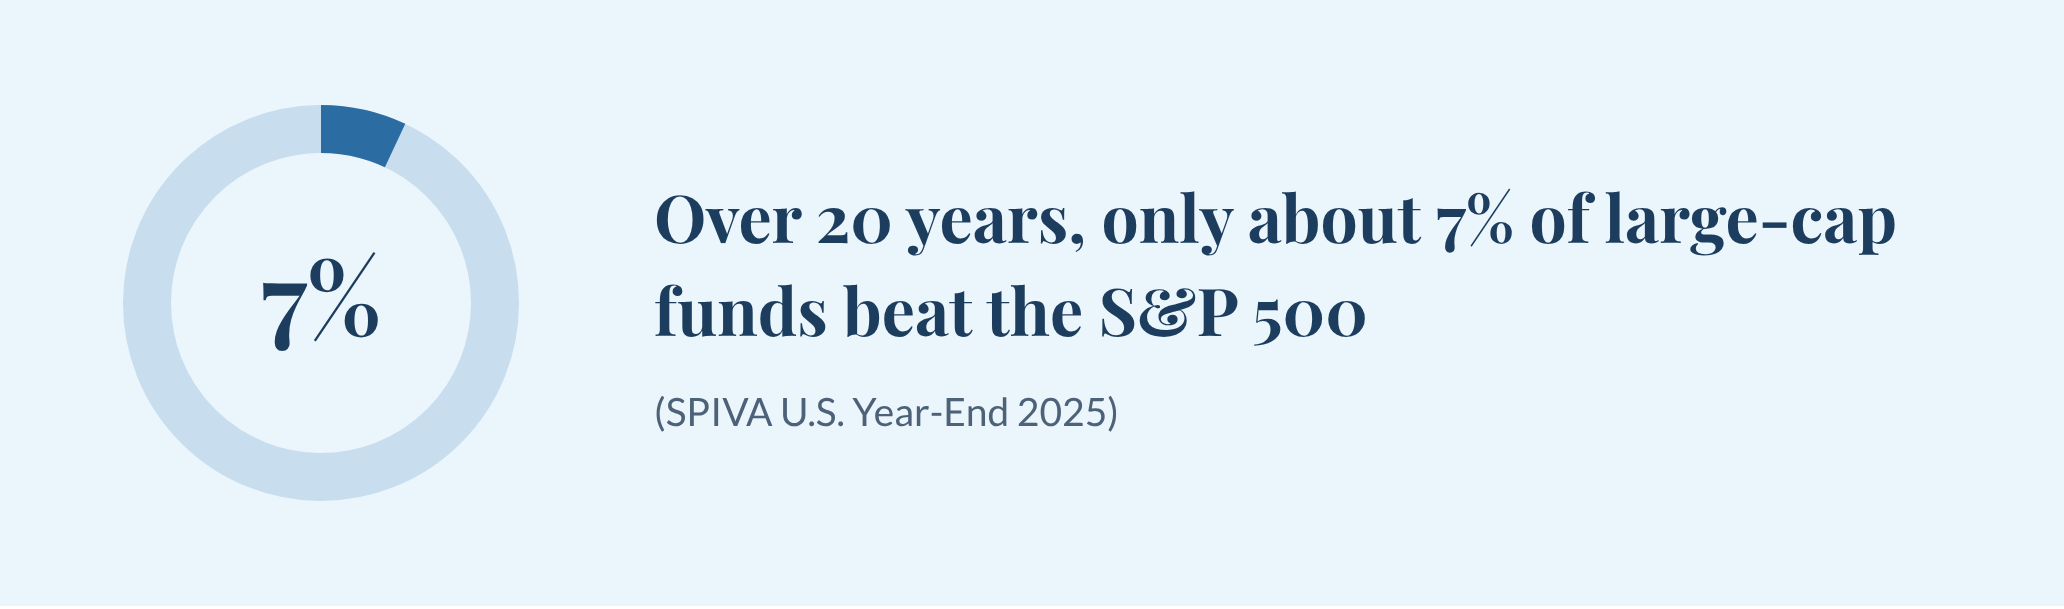
1. What Passive Investing Is, and Why It Works Passive investing means gaining market exposure through an index fund rather than trying to pick winning securities. The evidence is long and consistent. Over the 20 years ending December 2025, about 93% of actively managed U.S. large-cap funds trailed the S&P 500 after fees. Funds that do outperform rarely keep doing so.
Source: S&P Dow Jones Indices, SPIVA U.S. Year-End 2025 and U.S. Persistence Scorecard Year-End 2025. Past performance is no guarantee of future results.
2. “Active Passive” in Practice Passive does not mean autopilot. Someone still has to set the asset allocation, choose which indexes to own, pick the funds that track them, decide on modest strategic tilts, and rebalance with discipline. Those decisions typically drive results far more than security selection does. The realistic goal is market-like returns with a few deliberate advantages, not beating the market with large bets.
3. Why Passive Fits Nonprofits, and How Boards Oversee It Nonprofit governance has particular features: volunteer fiduciaries, rotating committees, a legal duty under UPMIFA to keep costs “appropriate and reasonable,” and an annual spending draw that every basis point of cost competes with. Passive portfolios suit those features well. For organizations that are not positioned to use illiquid alternatives, choosing simplicity and liquidity can be a legitimate fiduciary decision, not a compromise.
Passive investing means gaining exposure to a whole market at very low cost instead of trying to pick the parts of it that will do best. Decades of data show that, after fees, this simple approach beats most professional stock pickers over long periods (SPIVA U.S. Year-End 2025).
To many board members, “passive” sounds like no one is minding the store. That is not what it means. The word describes how securities are chosen inside a fund. It says nothing about whether anyone is managing the portfolio.
An index is a published list of securities chosen by fixed rules. The S&P 500, for example, holds about 500 large U.S. companies. Most indexes are capitalization-weighted: each company counts in proportion to its total market value, so larger companies carry more weight.
An index fund seeks to buy the securities in an index in similar proportions. It does not try to guess which ones will do better. Index funds come in two common wrappers:
An active fund, by contrast, employs managers who try to beat an index. They do this by picking securities they expect to outperform, or by timing when to be in or out of the market.
It helps to think of a range rather than two boxes:
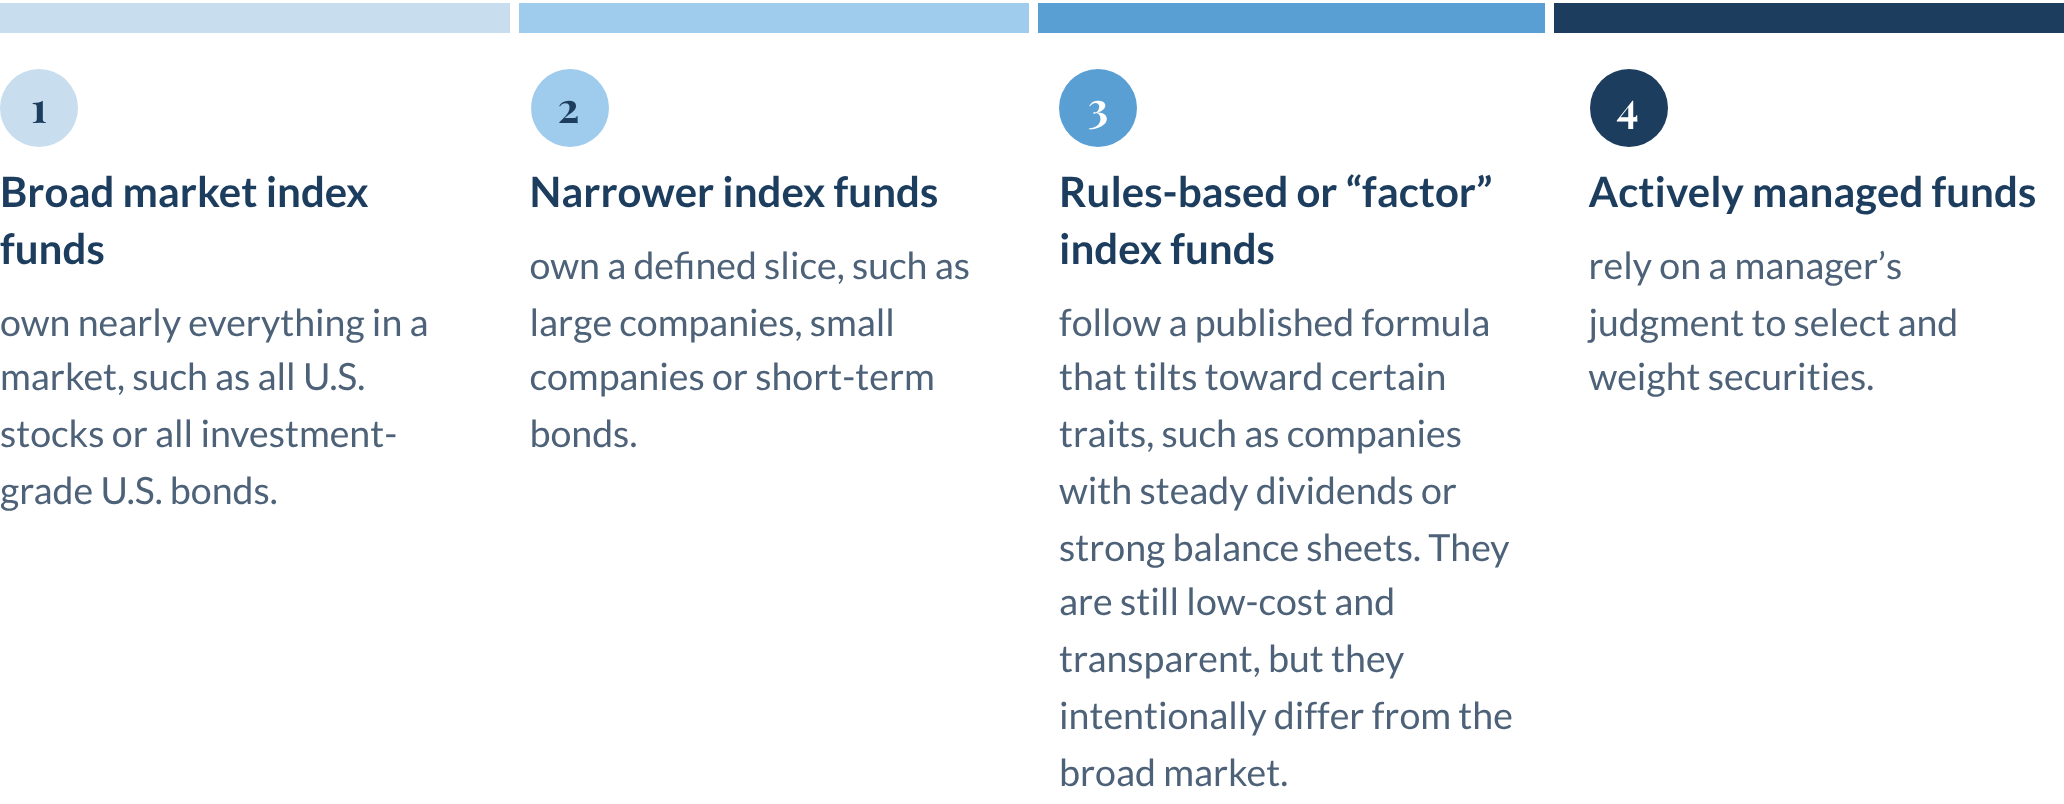
Most well-built passive portfolios use the first three. Some also hold a small number of active funds where there is a specific reason to (see Part 2).
S&P Dow Jones Indices has tracked active funds against their benchmarks since 2002 in its SPIVA® (S&P Indices Versus Active) Scorecards. The pattern is consistent: in any single year, a meaningful minority of active funds win. Over longer periods, that minority shrinks sharply (S&P Dow Jones Indices, SPIVA® U.S. Year-End 2025 Scorecard).
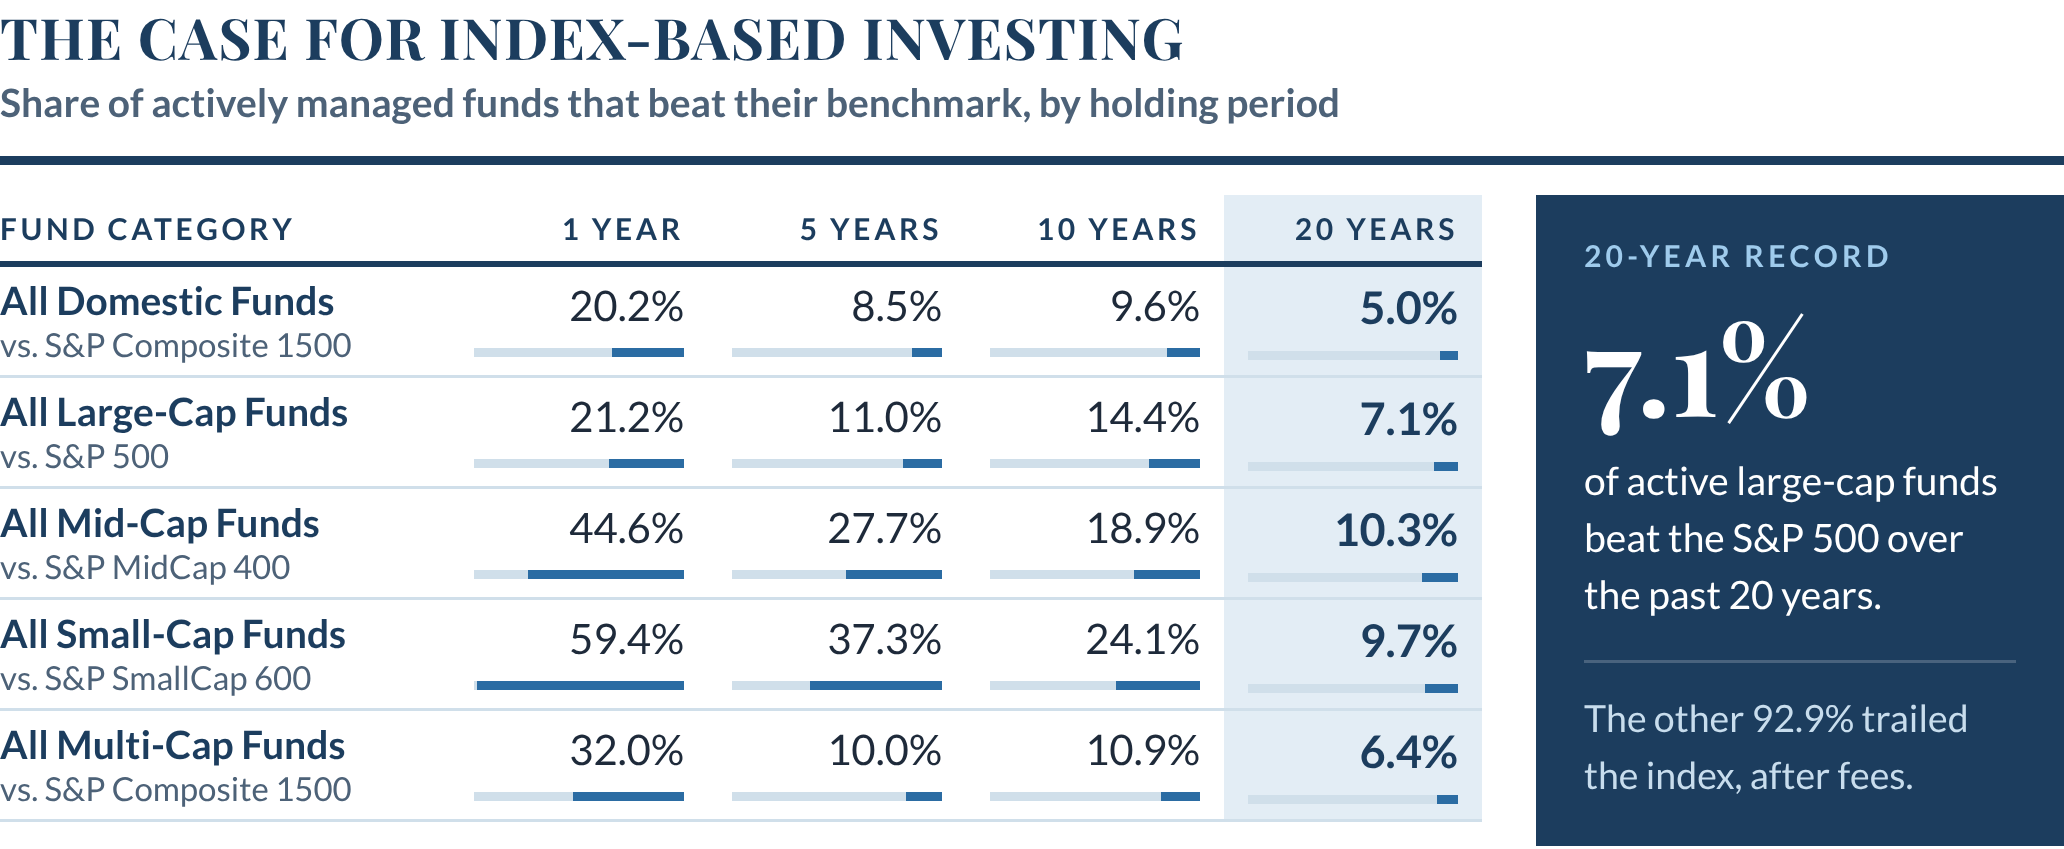
Source: S&P Dow Jones Indices LLC, CRSP, SPIVA U.S. Year-End 2025. Data as of December 31, 2025. Figures show the percentage of actively managed funds that outperformed their comparison index, net of fees, over each period. Index returns do not reflect fees or expenses, and it is not possible to invest directly in an index. Past performance is no guarantee of future results.
Three points from the data matter most for a board:
The Odds Get Worse with Time Nonprofits invest for decades. Over 20 years, only about 7% of large-cap funds beat the S&P 500 (SPIVA U.S. Year-End 2025).
Winners Rarely Stay Winners Among the top-quartile U.S. stock funds of 2021, none in the large-cap, mid-cap or multi-cap categories stayed in the top quartile in each of the next four years (U.S. Persistence Scorecard Year-End 2025, Report 2). Hiring last period’s star manager is a weak strategy.
Bonds Vary More Year to Year Bond results swing more from year to year. In 2025, 70% of active bond funds trailed their benchmarks on average across categories, a higher rate than for stock funds, while in 2024 most bond categories saw a majority of funds outperform (SPIVA U.S. Year-End 2025 and Year-End 2024).
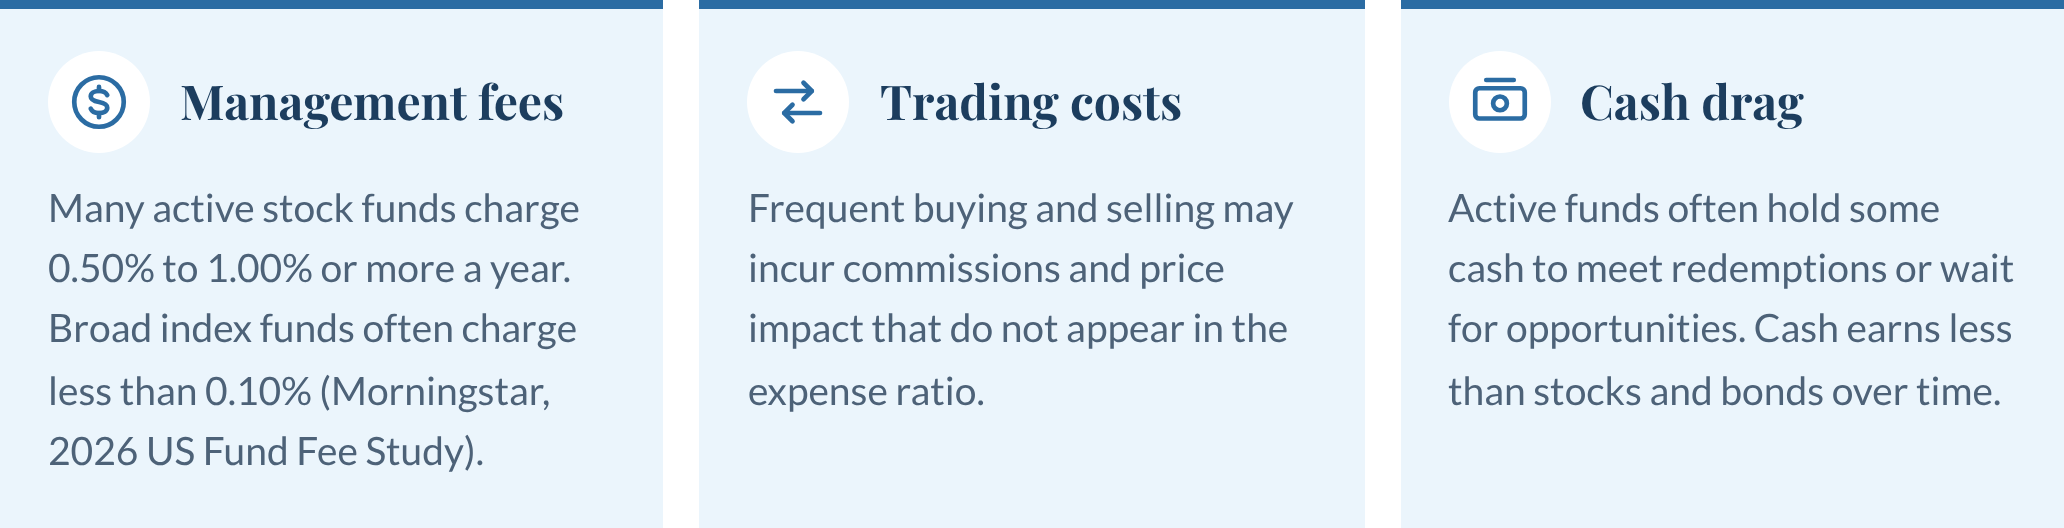
Active funds face several costs that index funds largely avoid:

To be fair to active managers:
The challenge is not that good managers never exist. It is that identifying them in advance, and staying with them through their inevitable bad stretches, is very difficult. For most nonprofits the real question is not “Can active managers win?” but “Can we reliably choose the ones who will?”
“Passive Means Settling for Average”
Owning the market at low cost has historically beaten most professional stock pickers over long periods (SPIVA U.S. Year-End 2025). Over those periods, that has been an above-average result, not an average one.
“Passive Means No One Is Making Decisions”
Every passive portfolio is built from a series of active decisions. Part 2 describes them.
“Passive Means Owning the S&P 500”
The S&P 500 is one index among hundreds. A diversified passive portfolio typically includes U.S. and international stocks of different sizes, plus bonds.
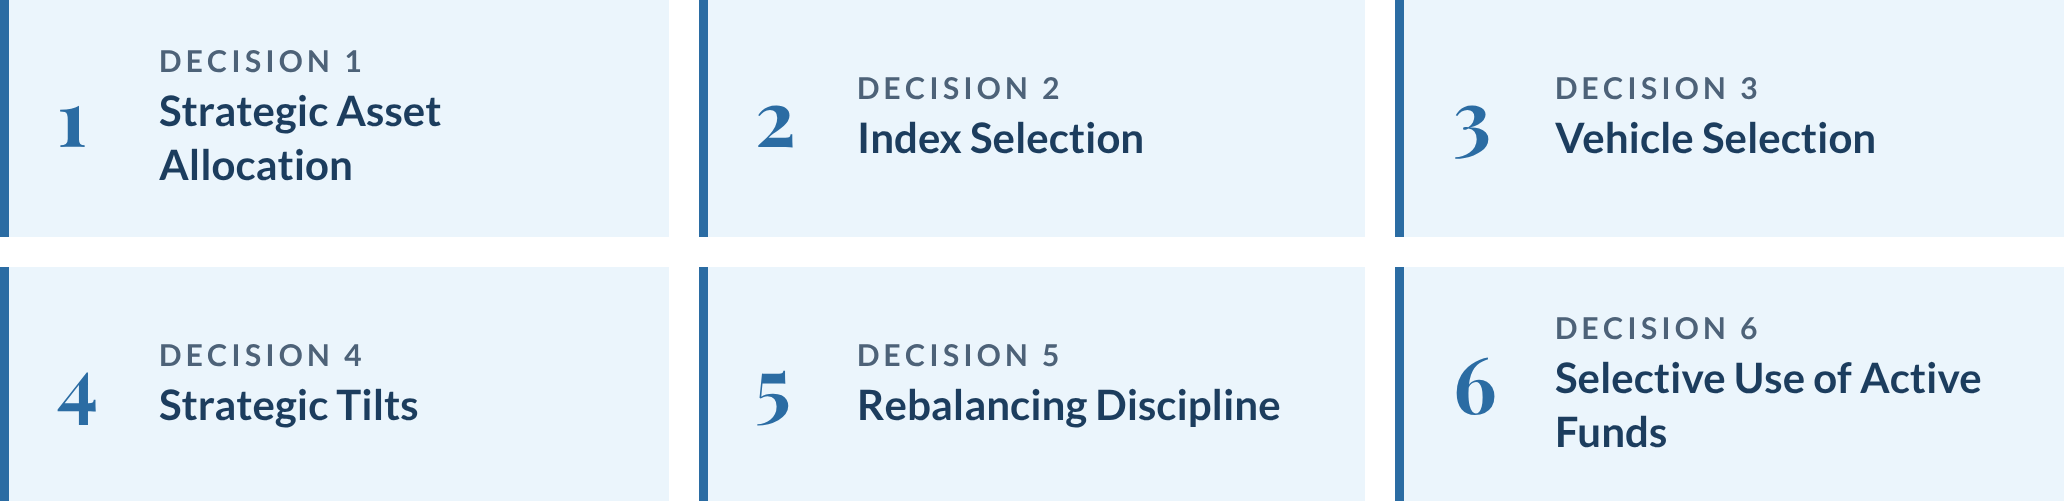
A passive portfolio still requires many active decisions. What changes is where the effort goes. Instead of trying to pick winning stocks or time the market, a well-run passive program puts its judgment into the choices that most affect long-term results: the asset mix, the indexes, the funds, a few deliberate tilts, and the discipline to stick with the plan.
The asset allocation is the long-term mix of stocks, bonds and cash, along with the major categories within each. It is the single biggest driver of how a portfolio behaves: how much it is likely to earn, and how far it might fall in a bad year.
For a nonprofit, the allocation should start from the organization’s purpose for the money. A permanent endowment with a 5% spending policy and a time horizon measured in generations can hold more stocks. A reserve fund that may be needed within three years needs more stability. Many organizations hold several pools with different purposes, and each deserves its own allocation.
The allocation should then be codified, with target weights and permitted ranges, and revisited periodically as the organization’s needs change or as market expectations shift.
Once the allocation is set, each part of it needs an index to fill it. Indexes that sound alike can behave quite differently.

Several funds often track the same index. They are not identical. The factors worth comparing include:
The differences are often small. Across a whole portfolio and many years, they may add up.
A tilt is a deliberate, modest difference from the broad market, held for a long time for a specific reason. Tilts are where a passive program can pursue some advantages without abandoning the discipline of indexing. Two simple examples:
Tilts should be implemented within policy ranges and evaluated over a full market cycle. Short-term differences from a broad benchmark are expected and are part of the approach.
Markets move, and over time a portfolio drifts away from its targets. Rebalancing means trimming what has grown and adding to what has shrunk, which brings the portfolio back to its intended risk level. It is designed to be a systematic way to trim assets that have risen and add to those that have fallen.
It is also emotionally hard. Rebalancing means adding to stocks after they have fallen and the news is grim, and trimming them after a strong run when optimism is high. A clear rule written into policy, such as rebalancing when an asset class moves outside its range, removes the need to make that call under pressure in a committee meeting.
A passive program does not have to be 100% index funds. There are a few situations where an active fund can earn its place:
The bar should be higher for these funds: a clear reason, a reasonable fee, and an agreed way to judge whether they are doing their job.
Put together, these decisions support a realistic goal. The aim is not to beat the market through large bets. It is to capture returns close to those of the markets the portfolio owns, at low cost, with a few modest and well-understood tilts that seek to take advantage of market opportunities while keeping the portfolio aligned with the organization’s objectives.

The benefits of passive investing are relevant to many investors. For nonprofits, passive investing can be especially compelling because of how they are governed, the laws that apply to them, and the way their spending works.

Most nonprofit investment committees are made up of volunteers. Some have deep investment experience; many do not. They may meet a few times a year, usually alongside a full agenda. Members rotate off every few years, and institutional memory leaves with them.
An investment approach for that setting should be:
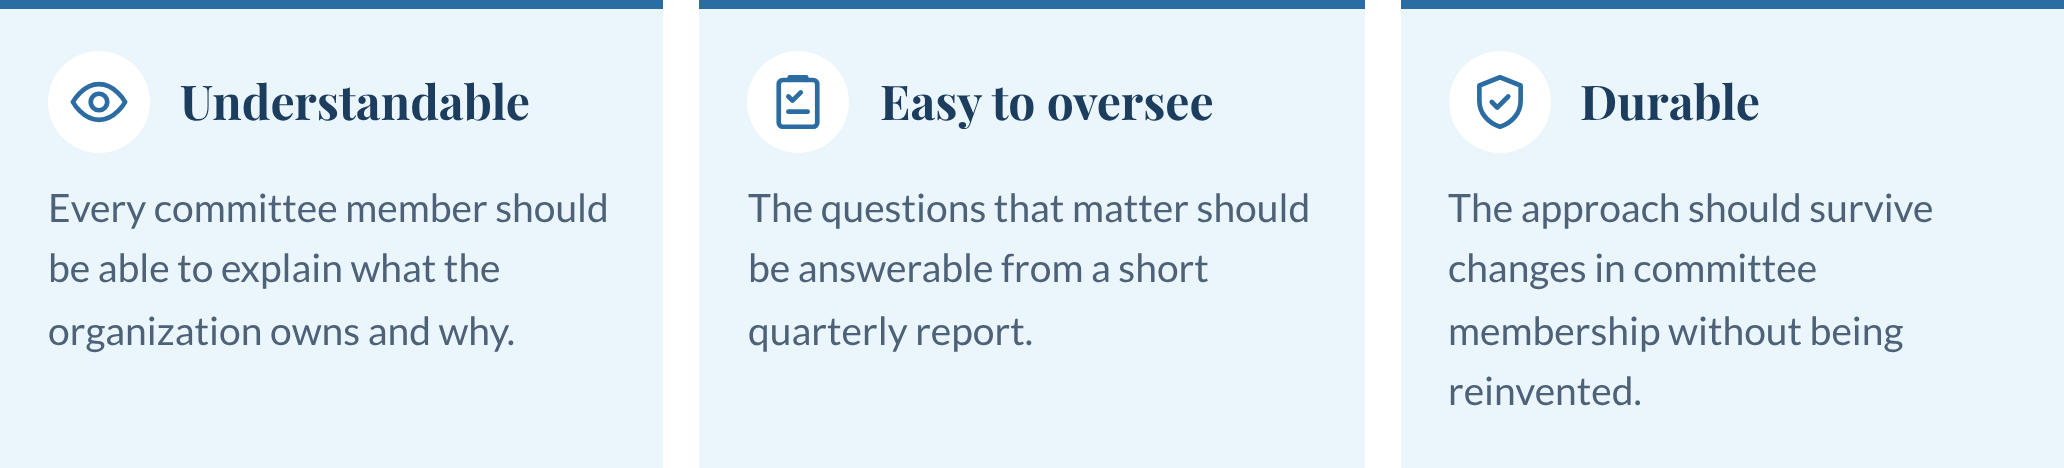
Passive portfolios meet those tests well. A portfolio of a dozen index funds can be described on one page. A portfolio of many active managers and transactions often cannot.
In most states, nonprofit investments are governed by a version of the Uniform Prudent Management of Institutional Funds Act (UPMIFA). Its investment standards generally apply to endowments and other funds a nonprofit holds for its charitable purposes, which can include board-designated reserves and other long-term investment pools. UPMIFA asks boards to act in good faith and with the care of an ordinarily prudent person. It also states that an institution:
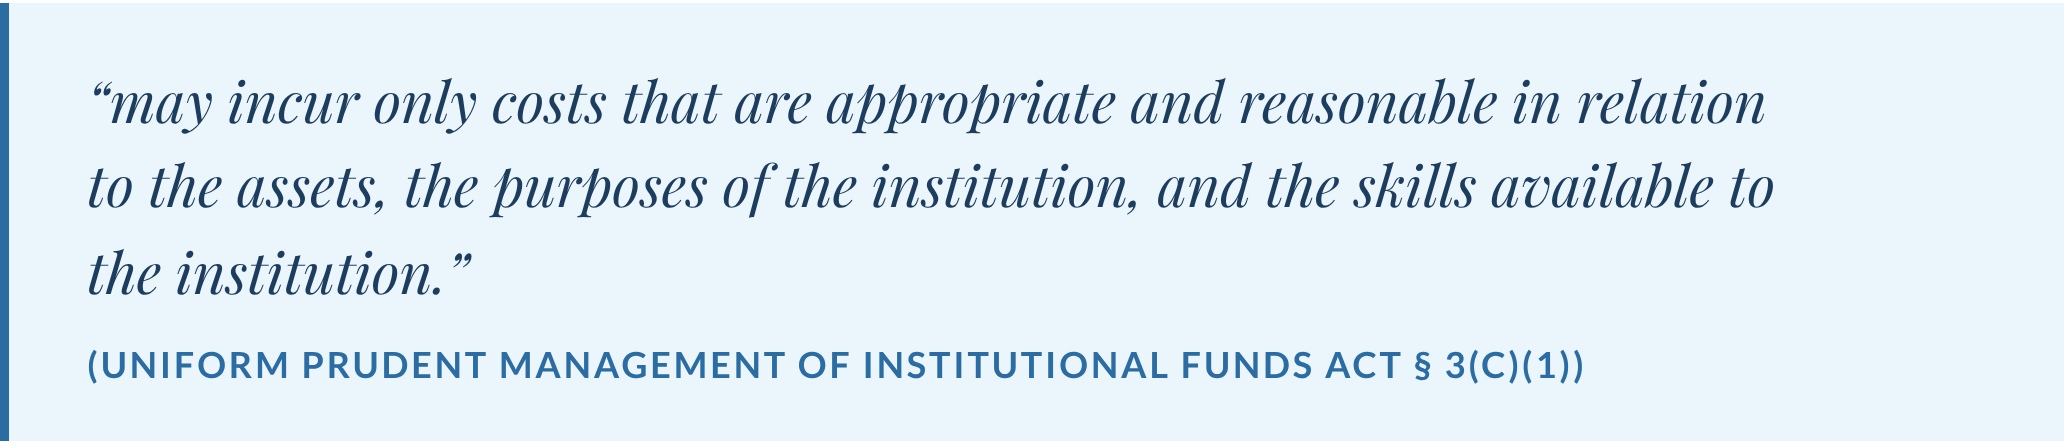
The standard is not “lowest cost no matter what.” It is cost that is justified by the organization’s size, purpose and capabilities. Low-cost index funds can make this standard easier to meet and to document. Higher-cost strategies can also be prudent, but the board should be able to explain what the extra cost buys.
This paper is educational and is not legal advice. Boards should consult counsel on how their state’s version of UPMIFA applies.
Nonprofit endowments commonly target annual spending of 4% to 5% of their value.1 Every dollar of cost comes out of the same returns that fund that spending. Cost differences that look small as percentages are large compared with what the mission actually receives.
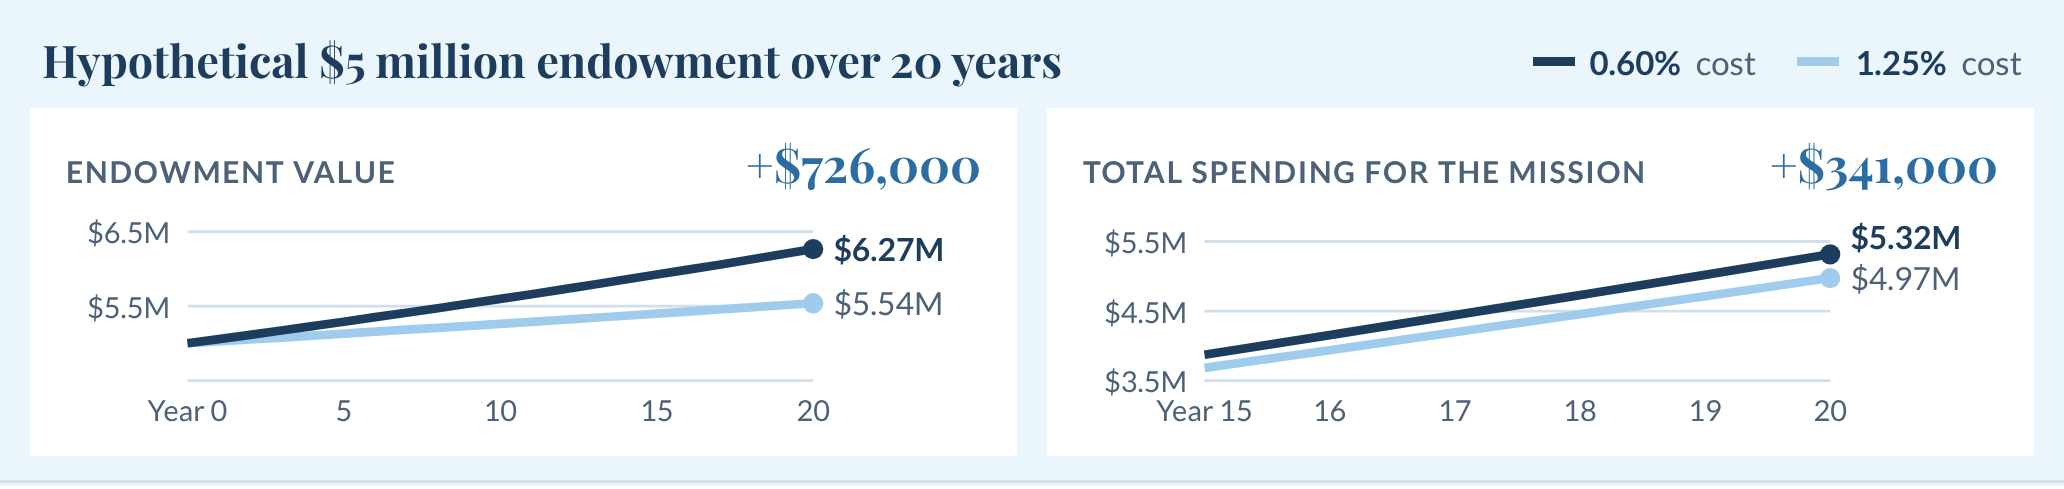
Consider a hypothetical $5 million endowment that earns 6.5% a year before costs and spends 4.5% of its value each year. The two cases differ only in all-in annual cost (fund expenses plus advisory fees): 0.60%, intended to illustrate a relatively low-cost index approach, versus 1.25%, intended to illustrate a higher cost. After costs, they net 5.9% and 5.25% a year. Because spending is a share of the endowment’s value, the faster-growing portfolio also pays out more each year.
1 SEI, 2023 Nonprofit Spending Policy Research, October 2023.
The lower-cost portfolio funds about $341,000 more for the mission over 20 years and ends about $726,000 larger. In the first year alone, the cost difference is $32,500, roughly one-seventh of a typical year’s distribution.
Hypothetical illustration for educational purposes only. The 6.5% annual return, 4.5% spending rate and cost levels are assumptions chosen to show the effect of costs; they are not projections and do not represent the performance or fees of any actual account, strategy or eCIO client. The illustration assumes a constant return with no market volatility, which real portfolios do not experience. Actual results will vary and may include losses. Spending is calculated each year as 4.5% of year-end value after returns and costs; no contributions, taxes, or inflation are assumed.
Index funds are generally priced every business day, their holdings are published, and their fees are disclosed. That makes them simple to value at year-end, simple for auditors to verify, and simple to explain to a donor who asks how a gift is invested. It also means a new committee member can understand the portfolio in their first meeting.
Organizations that want their investments to reflect their values have more index-based options than ever. Funds are available that screen out specific industries or tilt toward companies with stronger environmental or governance records. They can be less expensive than comparable active funds. Values screens change the portfolio’s exposures, so the board should understand how a screened index differs from the broad market. Screened portfolios may perform better or worse than unscreened portfolios, and screening may limit available investment opportunities.
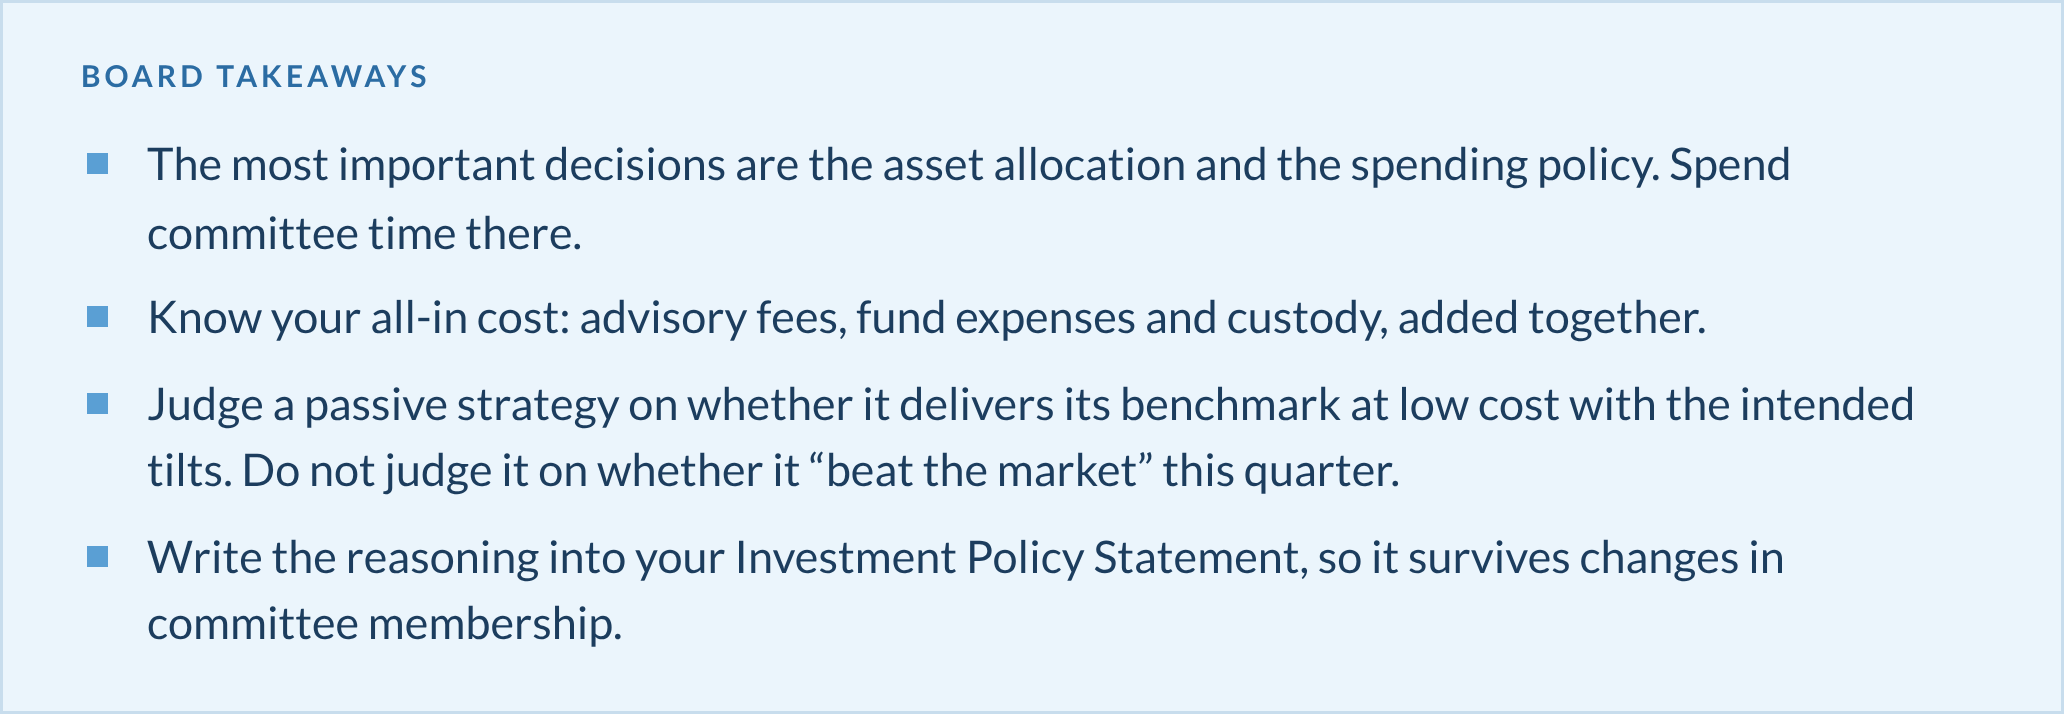
A passive approach changes what the board should look at. The questions shift from “Did our managers beat the market?” to “Is the portfolio doing what we designed it to do?”
Put it in writing. The Investment Policy Statement should set out the purpose of each pool of money, its target allocation and ranges, its benchmarks, and how the portfolio will be rebalanced and reported. A clear IPS lets new committee members understand the strategy quickly and keeps decisions consistent over time.
Evaluate on the right measures. Each quarter, the committee should be able to answer:

Build in behavioral guardrails. The biggest risk to a sound long-term strategy is often the committee itself. A sharp market decline, a new member with a strong view, or a neighbor’s endowment that did better last year can all prompt changes at the wrong time. Three practices help:
S&P 500®, S&P MidCap 400®, S&P SmallCap 600®, S&P Composite 1500® and SPIVA® are registered trademarks of S&P Dow Jones Indices LLC or its affiliates. eCIO is not affiliated with S&P Dow Jones Indices, Morningstar, or SEI.
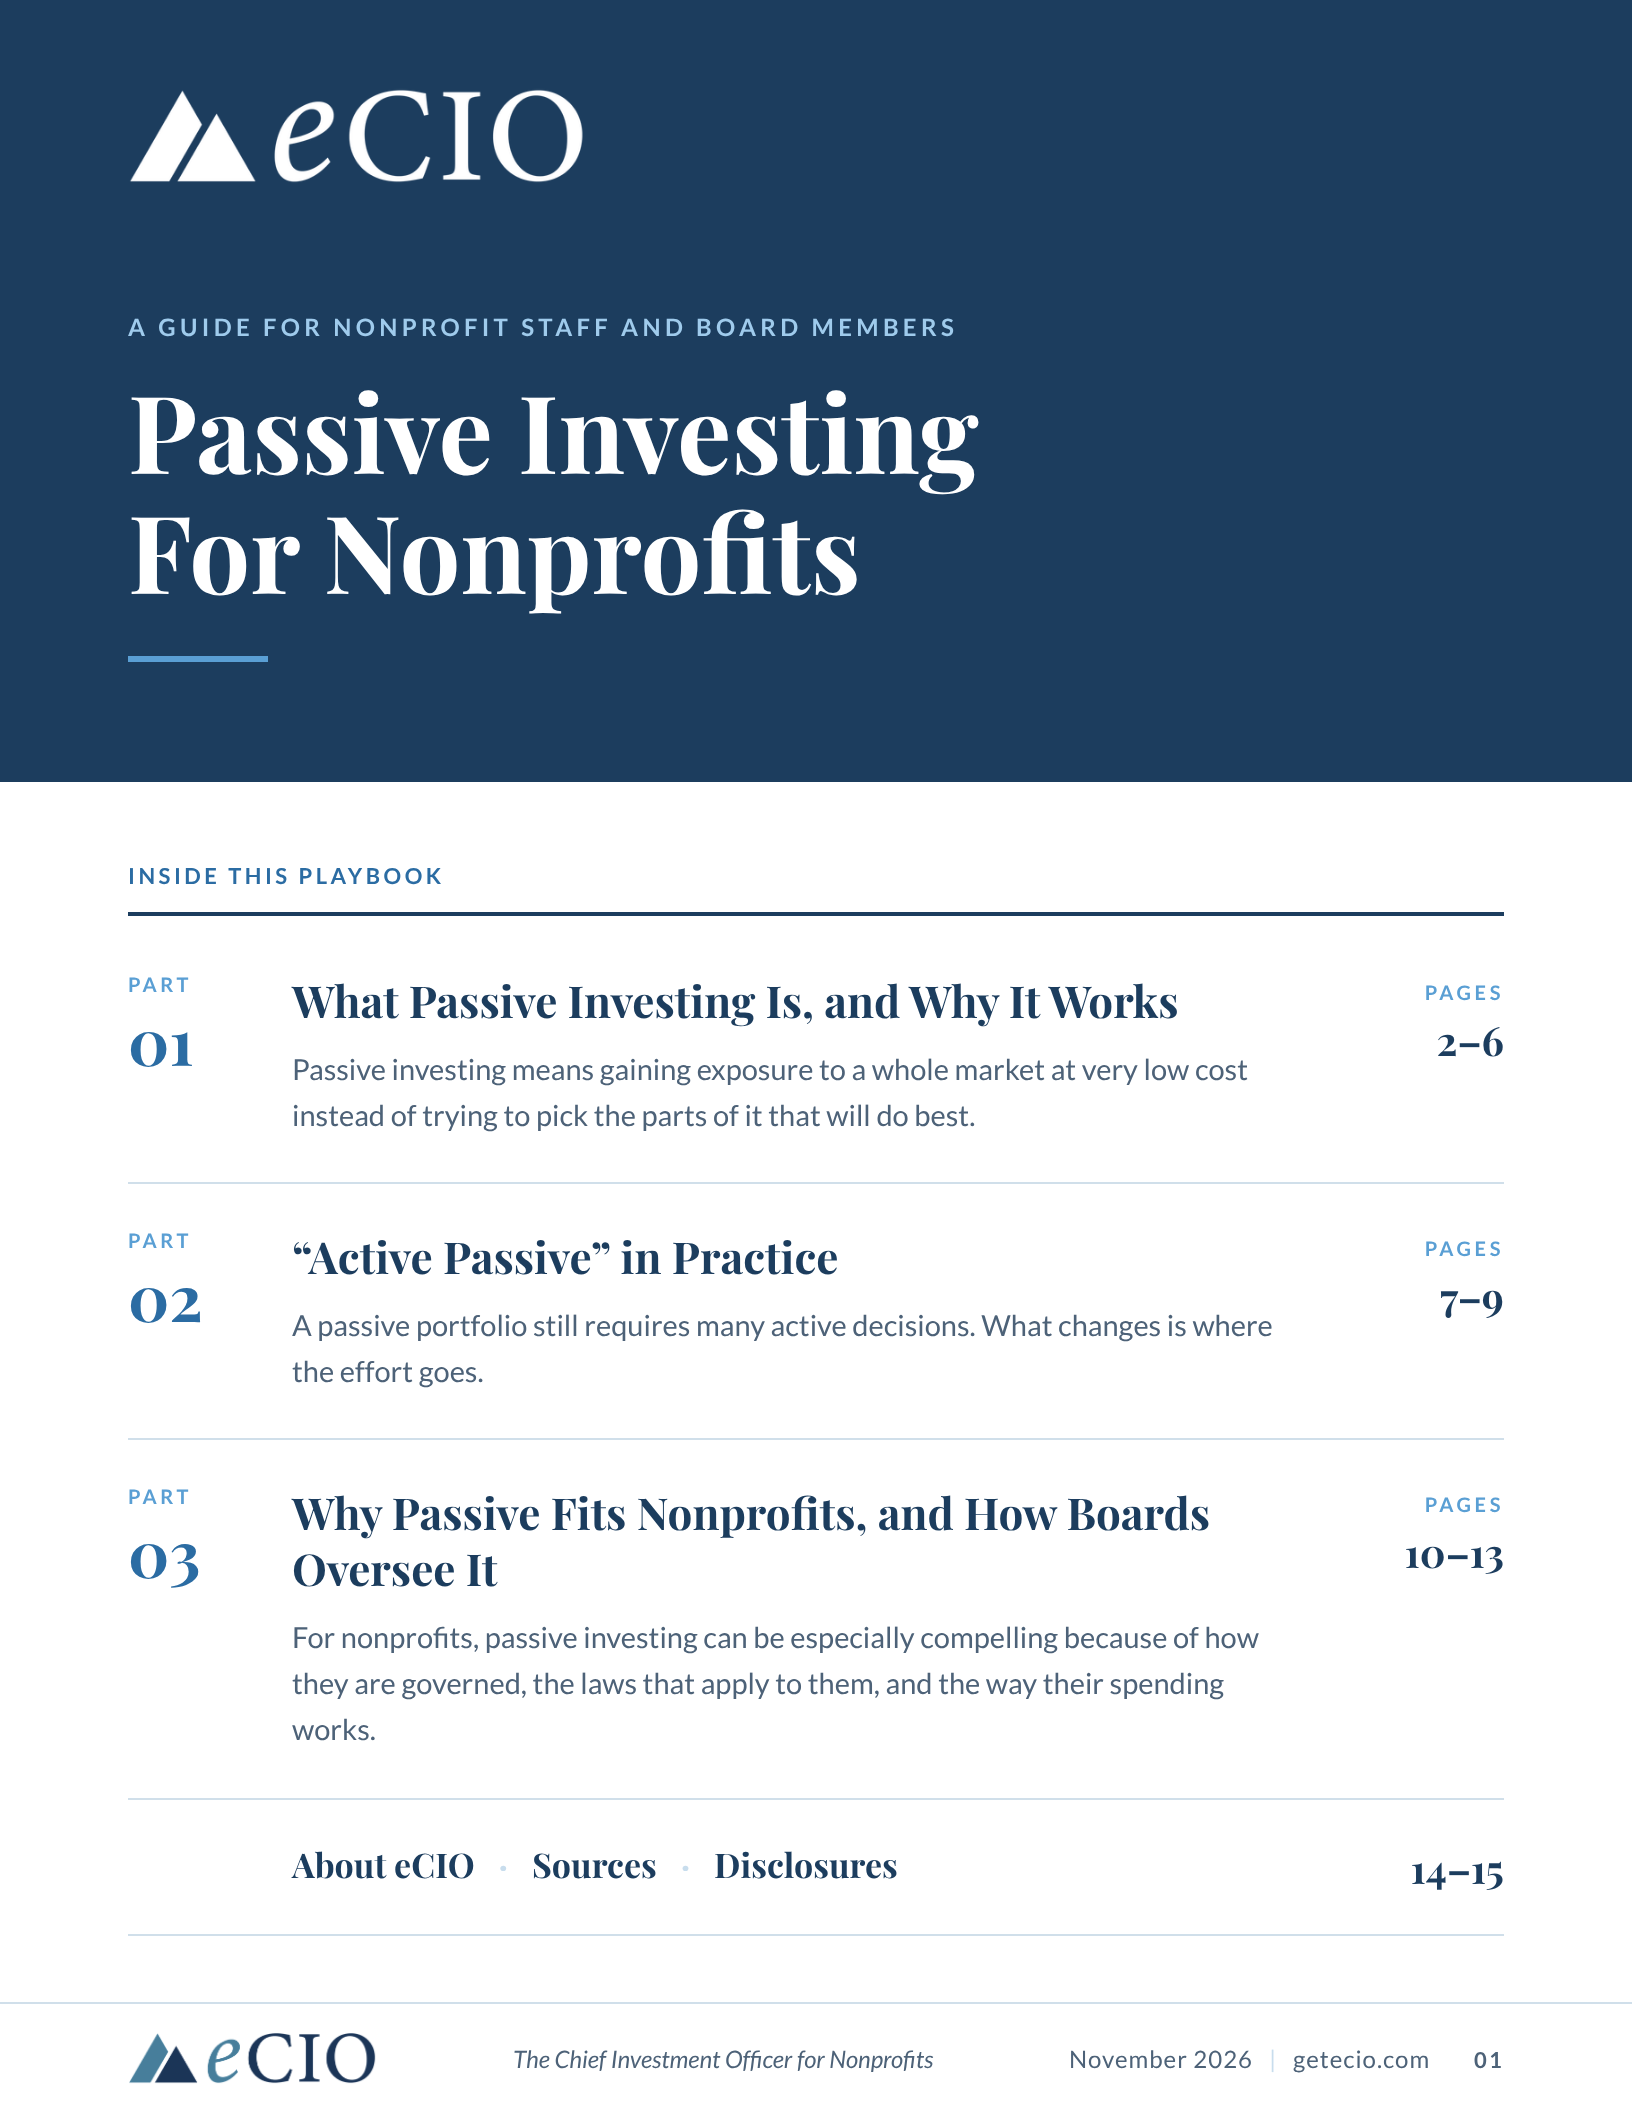
Download our Passive Investing for Nonprofits Guide to learn how low-cost, index-based strategies can reduce investment expenses, simplify portfolio oversight, and help your nonprofit build a sustainable investment program that supports its long-term mission.


We'd like to learn more about your organization and understand your unique investment needs.
Or call: (608) 291-4646
Get notified of new guides and resources and receive monthly market commentaries.
Schedule a time to speak with a nonprofit investment advisor
Whatever your investment needs, our advisors are here to answer questions or explain your investment options in more detail.
(608) 291-4646 or hello@getecio.com
Select a meeting type:

15-Minute Question & Answer Session
Ask an advisor a question about your current or future investment program.


30-Minute Investment Overview
Learn how eCIO can help your nonprofit establish and enduring investment program.

60-Minute Consultation
Schedule a meeting with your investment committee.



Have a quick investment question?
Submit a question and a nonprofit advisor will respond promptly.